Selected workKV / Feature Speed / reader’s tourPaper ↗

ICAIF 2026 submission · project lead · SCBX R&D

A forecast can be right
and still be costly to trade.

Follow the pressure from signal to cost.

The controls draw from separate paper experiments. Together they explain one causal chain, not one shared portfolio replay.

01

Input persistence

How much of the stock ordering survives one month?

Cross-sectional rank persistenceSchematic movement

Bar movements are non-quantitative. The adjacent AC and FSI values are measured endpoints.

Paper-defined class

57 accounting fundamentals

The paper groups these inputs by their construction and expected update frequency, before looking at returns or costs.

Pre-OOS rank AC
0.97
FSI contribution
0.03
Features
57
Fixed before evaluationFSIm(S) = meanj∈S observed(1 − rank ACj,m)

Each market uses the 60 months before its first out-of-sample return. The feature set and its FSI are then held fixed through evaluation. Higher FSI means less persistent inputs.

Reading boundaryThe paper reports class-level construction and counts, but not the full characteristic membership list. This page does not invent unnamed examples.
02

Model response

The same small nudge can reorder predictions differently.

Before 0.01-SD nudge
    After nudge

      Schematic with measured endpointThe colored names are synthetic. The measured instability values are .001 for Ridge, .250 for XGBoost, and .237 for LightGBM. Local sensitivity is not turnover.

      03

      Update gate

      A stable target and a delayed trade are different choices.

      Nine-month target sequenceWhite: target · gold: traded

      Explanatory sequenceNo asset-month ledger is available, so the bars do not reconstruct trades. The adjacent endpoints are exact paper results. EMA trails new information; quarterly trading postpones portfolio changes.

      04

      Turnover and capped cost

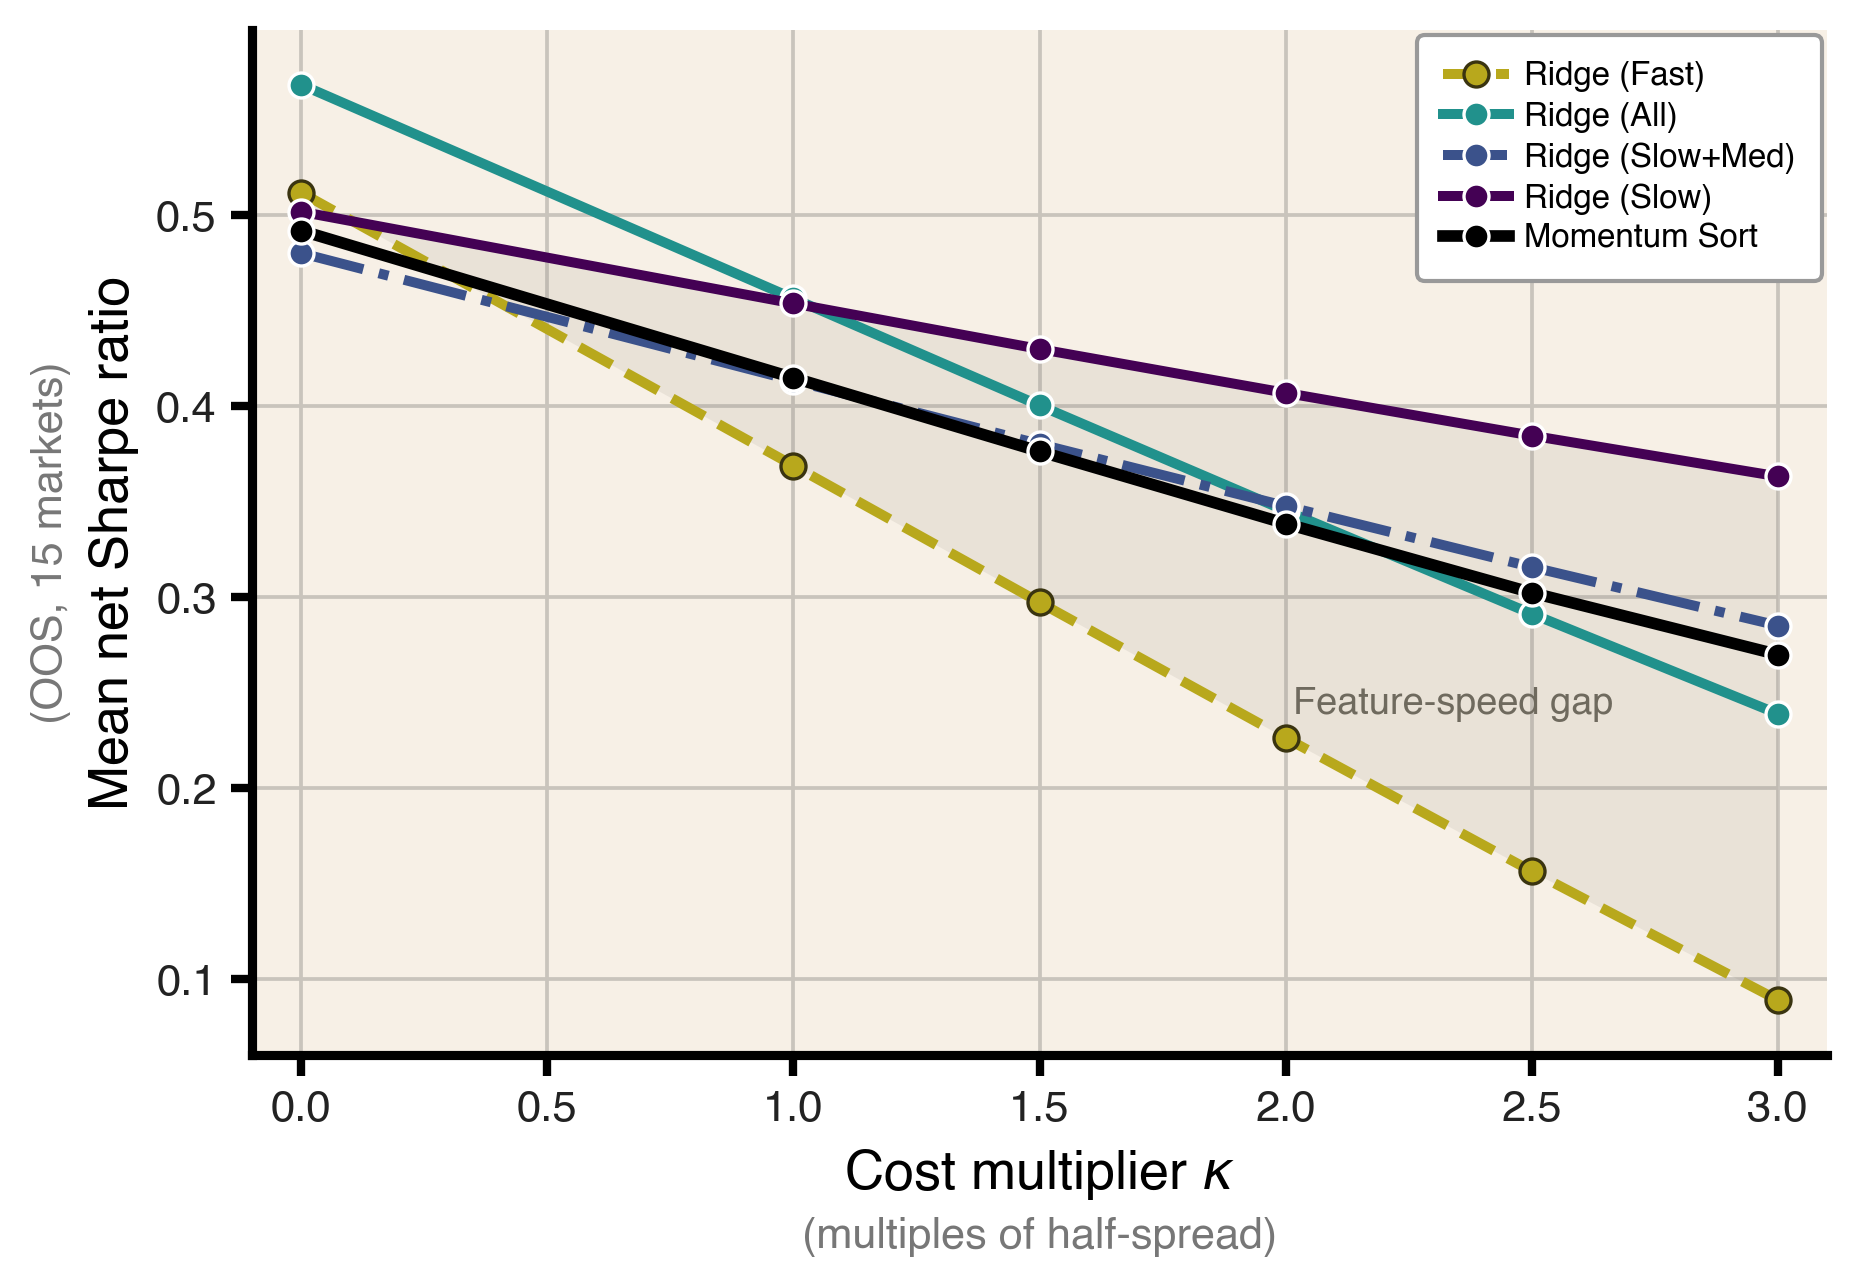
      As costs rise, the feature-speed gap widens.

      Paper chart of net Sharpe ratio by cost multiplier for five measured strategies
      Complete measured paper curve. The selector snaps to the six tested multipliers.
      StrategyGross SRNet SRTurnover
      Ridge Slow0.500.3610.2%
      Ridge All0.570.2423.3%
      Ridge Fast0.510.0930.1%
      Momentum Sort0.490.2717.0%

      Stress calibrationThe multiplier is not an estimate of taxes, commissions, FX, impact, or capacity. Clipping makes the curve nonlinear. This page does not interpolate between measured points.

      Input-induced trading pressure, not a complete model of turnover.

      Feature-set mean0.83

      FSI vs turnover

      Spearman correlation across 20 random, equal-sized Ridge sets.

      Feature-set mean0.80

      FSI vs SR loss

      Correlation with gross-to-net Sharpe loss at the 3× calibration.

      Paired comparison0.12

      Slow vs momentum p-value

      Slow Ridge wins in 10 of 15 markets, but the comparison remains imprecise.

      Paired comparison0.008

      Slow vs all p-value

      The paired market and calendar-block comparison is stronger.

      Limits worth carrying forward

      Random subsets match feature count, not family, missingness, or correlation structure.

      Within-market FSI prediction is much weaker than its ordering across feature sets.

      The perturbation experiment is local sensitivity, not realized turnover.

      Costs are estimated and the large-cap sample has 56 to 93 out-of-sample months per market.

      Without factor-adjusted alphas, return differences can include style exposures.